Excel
It's Time to either start or upgrade
Excel stands out due to its versatility, functionality, user-friendly interface, powerful data analysis capabilities, and data visualization features. It’s also highly customizable and great for collaboration.
Excel Beginner
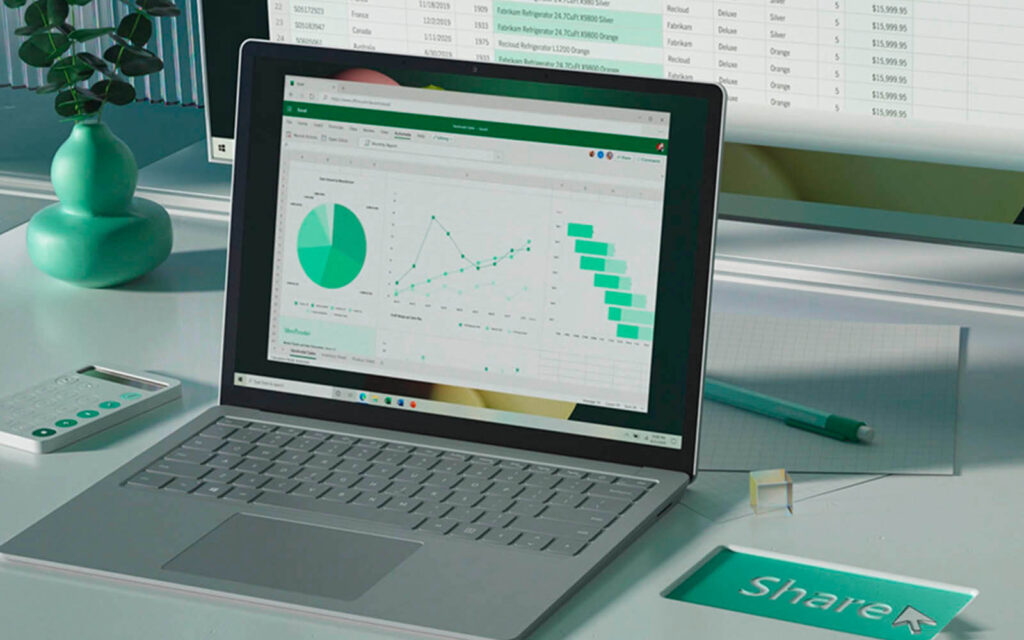
An Excel beginner masters fundamental functions, formulas, and data entry for efficient tasks. As proficiency grows, they explore pivot tables, charts, and advanced features, honing data management skills for informed decision-making.
Excel Intermediate
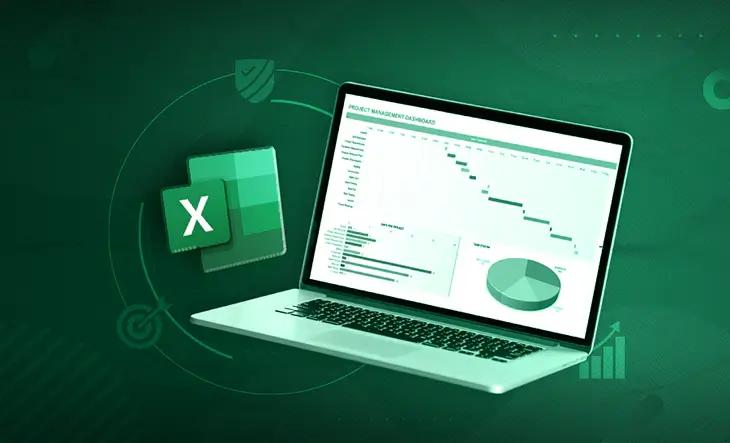
An intermediate Excel user has advanced from the basics and now uses more complex formulas, data analysis and visualization tools, pivot tables, macros, and custom programming to enhance data analysis and streamline workflow processes.

Excel Advanced
Advanced Excel users are skilled in utilizing advanced features for complex data analysis, automating tasks and solving business problems, demonstrating a deep understanding of Excel's capabilities for real-world decision-making.

Excel A-Z
Combine Excel Beginner, Intermediate and Advanced all in one nice package. Excel is a valuable tool for professionals as it helps them organize, analyze, and visualize data, automate tasks, perform complex calculations in modern workplaces.
Excel Pivot Tables
Excel pivot tables are a tool for summarizing, analyzing, and presenting data in an organized and dynamic way. They provide meaningful summaries, allow for interactive dashboards, enable advanced calculations and what-if analysis, and are valuable for data analysis and reporting.
Excel Power User
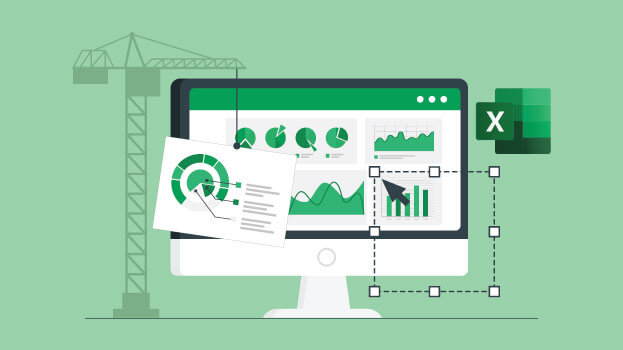
An Excel power user is someone who is highly skilled in using Microsoft Excel, proficient in advanced techniques such as macros, pivot tables, and advanced functions, and can effectively use Excel to analyze and present data. Solve complex problems, streamline work processes, and drive data-driven decisions.
Excel Macro's
Excel macros are a set of commands or actions recorded in Visual Basic for Applications (VBA) and can be run to automate repetitive tasks in Excel, saving time and improving efficiency.

Excel Advanced Pivot Tables
Advanced pivot tables are Excel tools that provide powerful data analysis capabilities, enabling users to organize and summarize large amounts of data in a flexible and dynamic way.

Excel Financial Modelling
Excel financial modeling is the process of using spreadsheet software (Excel) to create a representation of a financial situation, such as a balance sheet, income statement, or cash flow statement, to make informed financial decisions. It involves creating formulas, charts, and tables to analyze and interpret financial data.
Excel Advanced Charts
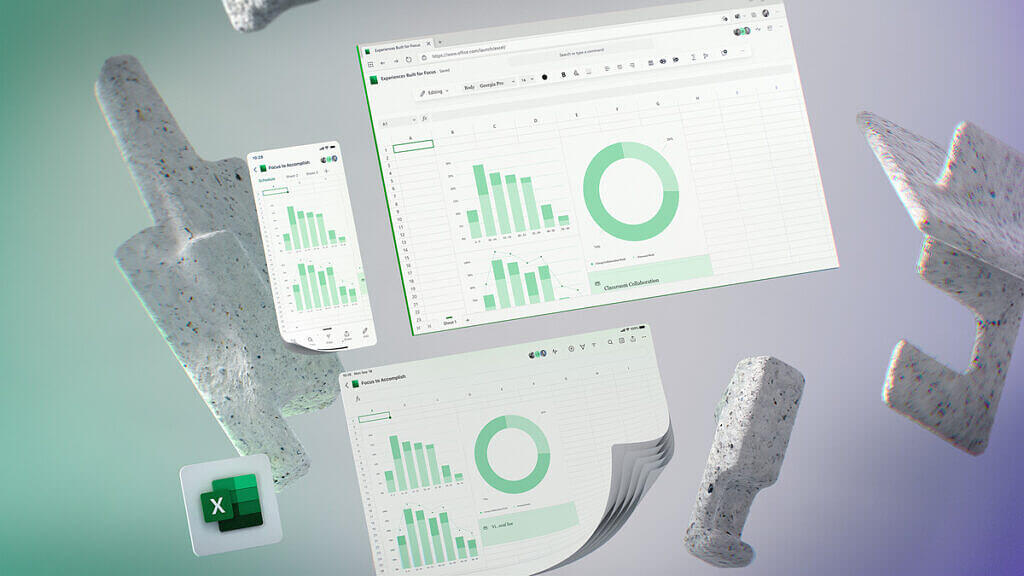
Excel advanced charts are graphical representations of data created in Excel, such as line charts, bar charts, pie charts, and others. These charts use advanced features to provide more flexibility and control in visualizing data, allowing for the display of complex data in a clear and understandable way.
Excel Dashboards
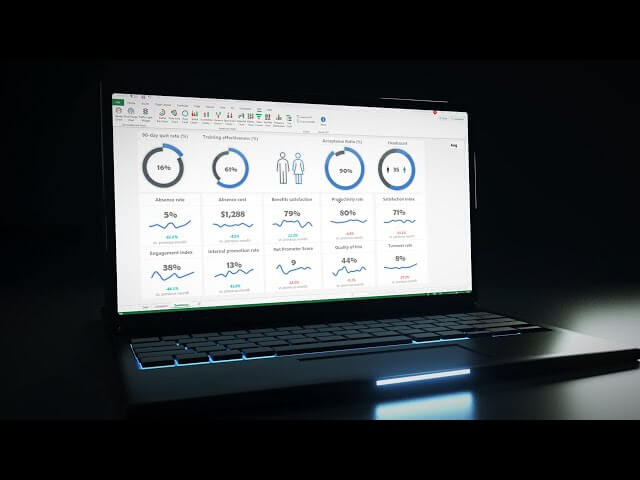
Excel dashboards are interactive visual displays that provide an at-a-glance view of key metrics and data. They help to track and analyze data, highlight important information, and make informed decisions.

Excel Killer Reports
Excel Killer Reports are a powerful tool for visualizing and organizing data. They display data in a clear, concise way, making it easier to analyze and understand trends, patterns, and relationships.
Excel Data Analysis
Excel data analysis refers to the process of cleaning, transforming, and modeling data in Excel to uncover insights and support decision-making. Use techniques such as pivot tables, charts, and formulas to manipulate data, identify trends, and draw conclusions. The goal is to turn raw data into meaningful information that can be used to inform business decisions.

Excel Query Editor
Excel Query Editor is a feature in Microsoft Excel that allows users to import, transform, and load (ETL) data from various sources into Excel for further analysis and manipulation. The Query Editor provides a user-friendly interface for performing data transformations, such as filtering and sorting, and allows users to create reusable data transformations for later use.

Excel Python
Excel Python is a feature that allows users to run Python scripts within Microsoft Excel. This feature enables users to manipulate and analyze data in Excel using the power and flexibility of Python programming. By using Excel Python, professionals can automate complex data tasks, perform advanced data analysis, and create custom solutions for their business needs.

Excel VBA
Excel VBA (Visual Basic for Applications) is a programming language built into Microsoft Excel that allows users to automate various tasks and operations in the spreadsheet program. It enables users to create macros, scripts, and functions that can be run within the Excel environment to streamline processes, automate repetitive tasks, and extend the capabilities of Excel.
Excel DAX
Excel DAX is a formula language used for data modeling and calculations in Excel. It provides powerful functions for handling and manipulating data.
Excel The Guru Series
Excel empowers data analysis, modeling, and visualization. Pivot tables, macros, Python, VBA, DAX foster informed decisions and impactful display.

Power BI - Introduction
Empower Your Insights: Unleash Data Potential with Beginner-Friendly Power BI for Visualizing and Analyzing Information Like a Pro.

Power BI - Advanced
Elevate Analysis: Harness Advanced Power BI Tools to Dive Deeper, Gain Actionable Insights, and Master Data-driven Decision-making.
Why learn Excel
Learning Microsoft Excel enhances data analysis and management skills by allowing efficient organization, manipulation, and analysis of data.
Excel increases productivity through various formulas, functions, and shortcuts, saving time and improving efficiency.
Solve complex problems in a simple and organized manner.
- Improved problem-solving Excel's versatility and functionality allow users to solve complex problems in a simple and organized manner.
- Career advancement Excel's visual aids enhance data comprehension for better decision-making.
- Better decision-making Excel's data visualization aids in making data easily understandable, leading to improved decision-making.
What You Get
You will get a comprehensive set of materials and resources designed to provide a well-rounded learning experience.
Receive course manuals or syllabus, lecture slides, practical exercises, assessments such as quizzes or exams.
Access our online learning platform or virtual classroom, and interact with instructors and other students.
- Onsite training is customized in-person training at the workplace, or in-class training, convenient and cost-effective
- Remote training with Teams offers online video conferencing for convenient and flexible access
- Hybrid training is a mix of onsite and remote learning, offering both in-person and online resources for a comprehensive training experience
